Overview
The core difficulty of getting code coverage with gcov for embedded systems is the following: a program instrumented to collect coverage data (compiled with --coverage compiler and linker flags) once run produces .gcda files for each source file. On a desktop/server this works fine. On an embedded device, this means you need storage and a file system to allow these files to be created which you can transfer to the host later to see coverage information.
Providing for storage and a file system just to get code coverage may be not so desirable, so a “hacky” approach is chosen, which works as follows:
- Run a
gdbdebugging session of your instrumented program - Try to trap into the
gcovfunctions that produce.gcdafile at the point of time where the coverage information to be written is available in memory - Use
gdbcommanddump binary memoryto generate the.gcdafiles on your desktop
Existing Approaches
When I searched for existing tutorials, I found this. It presents the concept and the approach very nicely. However; when I used it, I was stuck at a hang inside the gcc function __gcov_flush which is the function that eventually creates .gcda files.
What I did is to port the whole gcc code that is required to implement gcov_exit (this and __gcov_flush are almost identical for our purpose) and plugged the whole source into my sample project to see what is causing the hang. It turned out to be an undocumented bug in the gcc code which I fixed and then I was able to get the coverage collection going.
I later also found this, which further echoes the approach I took.
Using My Ported Code
As you would figure out with the first reference tutorial I have provided above and the fact that an undocumented blocking bug exists, it is necessary to use a ported version of gcov code that I had to achieve to get the coverage going and at this point of time this nice tutorial (first reference) is not sufficient to achieve coverage.
Since it can be a bit overwhelming to use the port directly, I made a sample project that uses the port and serves as a mechanism to easily explain the process of getting the coverage data. However; if you want to directly work with the port, you can get it here. There is a README that explains how to integrate it into your project and generate the .gcda files.
NOTE: there is a significant difference between the reference tutorial and the approach you need to take while using my ported code. The reference tutorial introduces stubs for various C library functions, which are not needed when using my ported code. Please do not mix stubs from the reference while using the approach provided here.
In this post, I first present how to use the sample project to generate .gcda files, post which it’s easier to start integrating my port of gcov into your project.
Learn with a Sample Project
Get the sample project from github and follow the cloning and setup instructions in the README of this project. Once you are done, proceed here.
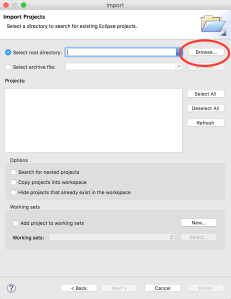
Import the Sample Project


Build the Project
-

- Build the Project

-

- Success in Console

-

- Errors to Ignore

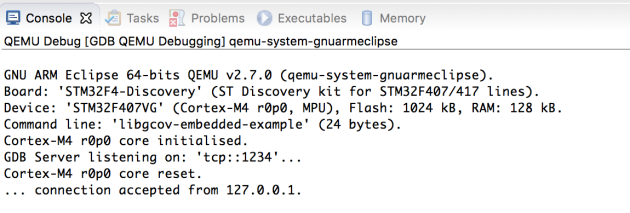
Start Debugging Session
As you would see while setting up, you can run this project either with a STM32F4-Discovery board using OpenOCD, or with a QEMU emulator for this board.
With QEMU
-

- Click the Down Arrowhead

-

- Select QEMU then click Debug

With STM32F4-Discovery using OpenOCD
First connect your STM32F4-Discovery device to your computer on a USB port and then do the following:
-
- Click the Down Arrowhead
-

- Select OpenOCD then click Debug

Get Familiar with Eclipse Debugging View
Once you choose any of the above debugging methods, Eclipse would prompt you (in case not done before) saying it would switch you to a different “perspective” for debugging. Say OK and it would take you to a view that looks like as follows:

Here is a break-up of the above view for your help:
-

- Thread & Stack Trace View

-

- Variables & Watches View

-

- Files Area for Line-by-line execution View

-
- Console & Logging Area

Setup Required Breakpoints
One of the required step is to setup two breakpoints. Set them up as follows:
-

- Open Breakpoints Tab

-

- Open gcov-io.c to setup breakpoints

-
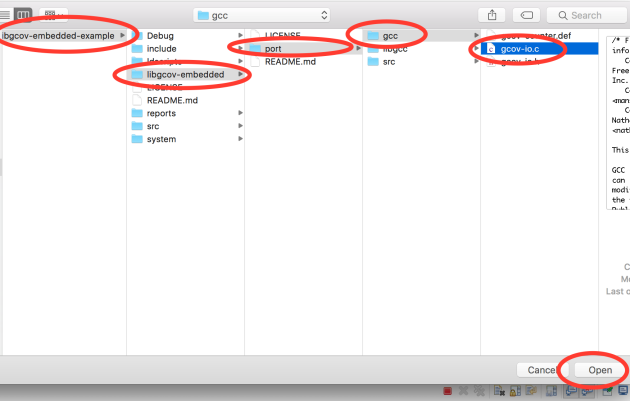
- Path of gcov-io.c

-

- File opened in Files Area

-

- Add breakpoint at line# 251

-

- Breakpoint appears in Breakpoints Tab

-
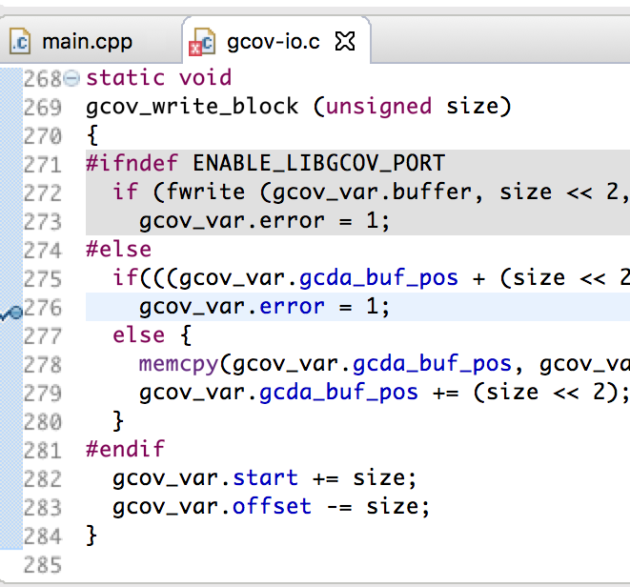
- Add breakpoint at line# 276

-

- Breakpoint appears in Breakpoints Tab

Setup Required Watch Expression
We need a watch expression for the variable __gcov_var__ported. Set it up as follows:
-

- Open Expressions View

-

- Blank Expressions View on Opening
-

- Add Required Watch Expression

-

- On Successful Watch Creation
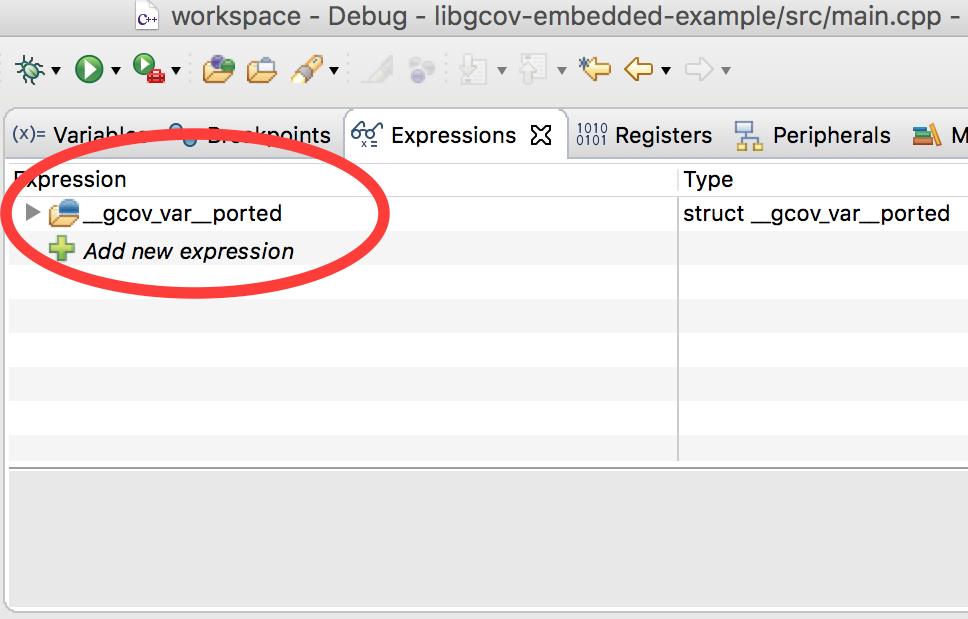
-

- Open Details and Keep for Using Later

Run Program
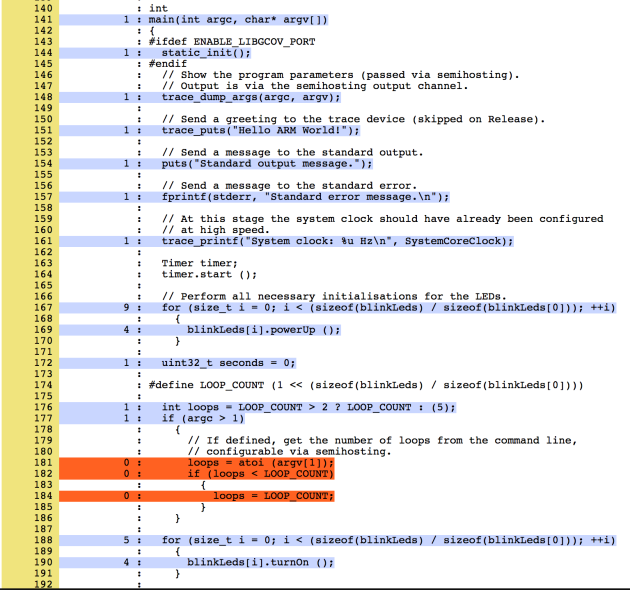
Click the  button to run the program and wait for hitting the breakpoints. It would run its main logic of turning on LEDs on the stm32f4-discovery board/emulator and then it would hit the line#251 breakpoint where it would stop.
View on Hitting the Breakpoint
This is what you would see in the stack trace and file area:
-

- Stack Trace

-

- Line in Green

The most important part of this view is the Expressions area. Here, you would see the complete path of the .gcda file that should be generated.
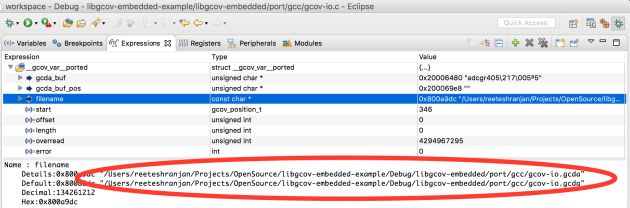
The filename field has the full path of a .gcda file
Generating the .gcda files
We are almost there! This is the time to generate the .gcda files.
Open the GDB Console
When the program stops on a breakpoint, you may not have the gdb console in the view at the bottom. Eclipse has various consoles, and there is way to switch among them. Do the following to get the gdb console:
-

- Open the gdb Console

-

- How gdb Console looks

Use dump binary command to create .gcda file
Type the dump binary memory command in the gdb console. Its syntax is as follows:
dump binary memory
The following snapshot shows you what values to provide for filename, start-addr and end-addr variables in the syntax above. We get the value from fields of the __gcov_var__ported variable as follows:
- The
filenamevariable comes from thefilenamefield. - The
start-addrvariable comes from thegcda_buffield. - The
end-addrvariable comes from thegcda_buf_posfield.

Once you press enter or return after entering the command, the .gcda file gets created; however, there is no message output to confirm that.
This is just one .gcda file!
That’s true! Now, it’s time to hit the button again and wait for the next hit of the breakpoint on line #251. This time it is going to be a different source file for which the .gcda file name would be shown. Do the same steps as above to create it.
Repeat the process till the program ends. You would be able to generate the .gcda files for all source files.
Coverage Data Visualization
Using Eclipse (Not Working Currently)
Eclipse has a nice integration with coverage data files. On clicking a .gcda file you can see a summary of code coverage data of the corresponding source file. However, because of this eclipse bug, which was not fixed at the time of writing this (present in even Eclipse Neon.1 – current version), viewing the coverage using colored lines per source file showing which lines got executed and how many times, and which did not, is not working currently.
Using lcov
lcov is a tool that generates HTML representation (looks very similar to how Eclipse view per source file should look).
Since lcov is not part of gnu arm toolchain, there are some compatibility issues making it work with the .gcda files we created here. However, I found the way to get this to work. I have presented the steps that work with the sample project below. The steps work for Linux/Mac. Similar steps would work even on Windows once you have installed lcov. On Mac, you can install lcov using Mac Ports.
Go to the Debug folder of the sample project.
$ cd /Users/reeteshranjan/Projects/OpenSource/libgcov-embedded-example/Debug
Execute the lcov command. We fix the compatibility by specifying the gnu arm gcov as the gcov tool to use to parse the .gcda files:
$ lcov --capture --output-file main.info --directory . --gcov-tool /usr/local/gcc-arm-none-eabi-5_4-2016q3/bin/arm-none-eabi-gcov
NOTE: The path of the gnu arm gcov may be different in your environment.
Now runt he genhtml command to create the HTML files.
$ genhtml -o html main.info
You would get a html directory with many files. Open the index.html file to see the coverage data visualization.
HTML files enclosed in Sample Project
The reports directory in the sample project contains the HTML visualization files I have made using my own run of the process in this post.
Example HTML Visualization
Here is a snapshot of how the HTML visualization looks:
Coverage of Your Own Project
After having seen the process with the sample project, it should be easy to use the ported gcov code in your own project to do the coverage data collection. The summary of what needs to be done is as follows:
- Include the ported
gcovcode into your project (see below on how) - In a
gdbdebugging session, set breakpoints and watches as explained above. These steps are the same for your project whether you use a command line gdb or through Eclipse or through any other IDE. - When the break point at line#251 in
gcov-io.chits, run thegdbcommanddump binary memory. The syntax and the values to provide have been explained above.
Get the ported gcov code from here. The README of the project explains the process to include it in your project.

“I have presented the steps that work with the sample project here.” Can you share the link for that (link missing)?
LikeLike
Changed to “I have presented the steps that work with the sample project below”. I meant to refer to the steps following that line. “here” => “in this blog”.
LikeLike
ah, ok, thanks!
LikeLike
I’m having problems with building the project. I’m on Fedora 28 so the versions of Eclipse and the toolchains are a bit newer than in the post, but I have tried using the toolchain you’ve specified in the GitHub README and I’m still having issues.
At first I get issues like this:
./system/src/stm32f4-hal/stm32f4xx_hal_flash.o:stm32f4xx_hal_flash.c:(.text._GLOBAL__sub_D_00100_1_HAL_FLASH_Program+0x2): more undefined references to `__gcov_exit’ follow
collect2: error: ld returned 1 exit status
make: *** [makefile:67: libgcov-embedded-example.elf] Error 1
I’ve found that newer versions of gcov have moved gcov_exit to __gcov_exit. If I modify your libgcov-driver.c and libgcov-embedded.h to match that, the error changes:
./libgcov-embedded/port/src/libgcov-embedded.o: In function `_exit’:
/home/spencermoss/eclipse-workspace/libgcov-embedded-example/Debug/../libgcov-embedded/port/src/libgcov-embedded.c:33: undefined reference to `gcov_exit__ported’
collect2: error: ld returned 1 exit status
make: *** [makefile:67: libgcov-embedded-example.elf] Error 1
It seems like gcov_exit is the only problematic function. I appreciate any help you can offer as I would really like to make this example work so I can work on porting it to my own usecase!
LikeLike
I ended up figuring this issue out – it was a linker issue caused by the fact that I was using my system’s default arm-none-eabi-gcc, which was on Version 7. It appears there is some breaking change between GCC 6 and GCC 7 with the port as-is that I haven’t figured out for now.
LikeLike
My wordpress admin panel was just not loading for several weeks. It finally did today and I could approve your responses. Thanks for your responses, Spencer!
LikeLike
Hello Sir, I tried to compile and use your port. I keep being stuck in file libgcov-driver.c at line 238 in function compute_summary
the instruction if (gfi_ptr && gfi_ptr->key != gi_ptr) gets my in hardfault
I badly need coverage and don’t know what to do at all. I am using sw4stm32 eclipse based toolchain
I would appreciated any help or advice has when in come to gcov in don’t understand how you did the port, just managed to adapt to my toolchain and compile.
I really need help as I found nobody or no doc to port gcov. the same for gprof
Thank you for your time and consideration
kind regards,
franck
LikeLike
I’m not sure but it sounds like some data or data structure incompatibility. It’s difficult to say more without seeing more in to your project configuration.
What I did to get to this port is to look into relevant portions of gcc and trim them to minimum piece of code I could plug into my project having my own implementation of gcov_exit so I could debug the hang encountered using Eclipse+gdb. I doubt you’ll find some one having a blog on how to port any such thing. Not enough comments in GNU sources means you’ll have to do it on your own.
LikeLike
Hi,
Thanks for posting this. But, I am still unable to get coverage. First of all, I am getting errors saying gcov_root and gcov_master are unresolved symbols. I made a temporary fix by defining these variables. Still, it looks like the gcov_root is empty. It appears that gcov_root is not being populated by the gcov instrumentation. I have done all the settings per this blog and the other blog referred here. Can you please help me with this?
LikeLike
Which GNU arm toolchain version are you using? Have you tried to build with the older version with which this port is compatible?
LikeLike
Thanks for getting back! I am using Sourcery Codebench Version: 2015.17-26 for ARM EABI, so I am confined to using the GNU arm toolchain that comes with it. It comes with GNU Compiler Collection version 5.2. Is this port a supplement to the gcov library? I am thinking the coverage initialization which populates the gcov_root is still supposed to happen as part of the ARM EABI gcov library for my case?
LikeLike
Hi,
I am using your port (https://github.com/reeteshranjan/libgcov-embedded) for coverage in my project.
I work with :
– STM32CubeIDE
– STM32F439ZITX
– Your port for coverage
I fallow the steps described on your post :
– Inlude port folder in project
– Add ENABLE_LIBGCOV_PORT preprocessor directive
– Add –coverage on linker flag and one of my c src file
– Add inlude and static_init() in main.c
I put a breakpoint on gcov-io.c:250, but it never hits.
Do you have any advice, did i miss something ?
Thanks for your help.
LikeLike
What is the GNU ARM toolchain version you are using?
LikeLike
I am using :
– arm-none-eabi-gcc-9.3.1 (gnu tools for stm32.9-2020-q2.win32_1.5.0.202011040924)
LikeLike
This looks way ahead of arm toolchain v5 that I used. Please try reducing your arm toolchain version gradually from 9 to 5 and see if you get the same error. Another person had a similar issue, which looks like code compatibility broken across the version changes, and it worked when the toolchain version was reduced.
LikeLike
Hi, tanks for your answer,
I switch for v5 of arm toochain.
I also add a call to “gcov_exit()” in my main file.
I am able to create the .gcda file via the dump binary memory.
Is it possible to create this gcda file without a GDB command ?
Thanks again for your help
LikeLike
Actually the fallowing is working :
FILE *file = NULL;
int length = gcov_var.gcda_buf_pos – gcov_var.gcda_buf;
file = fopen (gcov_var.filename, “wb”);
if (file!=NULL) {
(void)fwrite(gcov_var.gcda_buf, length, 1, file);
fclose(file);
}
free(gcov_var.gcda_buf);
Tanks
LikeLiked by 1 person
Great! Thanks for adding that here. It will help others!
LikeLike
Hi,
I wish to modify your code to make it work with g_flush() rather than gcov_exit() to prevent any ram issue during coverage.
Do you have any hints to give me ?
Thanks
LikeLike
I never got any notification for you May 2021 comment. I rely on that. Sorry; but I missed seeing your comment and replying.
LikeLike
the file pointer always returns NULL which
fopen, fwrite and fclose work fine with C project and do the functionality
but with the project it doesn’t perform the functionality ? do i have to edit any other functions ?
LikeLike
I am not very sure about the issue with the description in your comment. With the compiler version I used, the steps described are sufficient and nothing else is needed.
LikeLike
I m getting following error during debug:
Error in services launch sequence
Launching command [/undefined_path/qemu-system-gnuarmeclipse.exe –verbose –board ? –mcu ? –gdb tcp::1234 -d unimp,guest_errors –semihosting-config enable=on,target=native –semihosting-cmdline libgcov-embedded-example] failed.
Launching command [/undefined_path/qemu-system-gnuarmeclipse.exe –verbose –board ? –mcu ? –gdb tcp::1234 -d unimp,guest_errors –semihosting-config enable=on,target=native –semihosting-cmdline libgcov-embedded-example] failed.
Cannot run program “/undefined_path/qemu-system-gnuarmeclipse.exe”: Launching failed
does any changes required?
LikeLike
Hi Shravan,
I am sorry but I cannot figure out anything concrete with the information you have provided.
I have just one pointer from earlier discussions on this topic. What toolchain version are you using? If you are using anything above v5, which I used for my work, please try to downgrade your toolchain to a lower version and try to see if things work.
Reetesh
LikeLike
Thanks, for your response.
ported code is working fine with arm toolchain v5.
Is there any way to use same code on latest arm toolchains?
and using this GCOV tool on other compilers like IAR embedded workbench or code composer studio?
LikeLike
Shravan, this port was a port of code copied from the toolchain v5 source. Going by the compatibility issues faced by several people using later toolchains like v9 and how they had to downgrade the toolchain version towards v5, I don’t think the code will directly work. The idea used in the port, as explained in the blog, is something that has to be applied to each toolchain versjon’s source separately, is my best guess.
LikeLike
Hello Reteesh!
Thank you very much for your advise about toolchain!
I had problems, that no coverage data was collected inside the processor (STM32F4), because i used the toolchain from 2019. Now compiled with the v5, at least i can see in the debugger, that the coverge sturcture is filled 🙂
I still have a long way to go, but wiht your help, I can mke progress now!
greetings, Florian
LikeLike
Glad to know this helped you. What’s a bit sad for GNU fans like us is we have such issues even today!
LikeLike
Interesting, but I can’t get what is the purpose of running gcov on the target?
Using gcov to estimate efficiency of unit testing is something I normally use gcov for…
LikeLike
In embedded projects, it’s possible to cover all code branches on target in most cases, not on host with any simulation. Hence gcov on target.
LikeLike
Still… What is the benefit?
LikeLike
Still… What is the purpose? Checking for a dead code?
LikeLike
Interesting, but I can’t get what is the purpose of running gcov on the target?
Using gcov to estimate efficiency of unit testing is something I normally use gcov for measuring unit testing coverage.
LikeLike
More than dead code, code coverage for me is about not having any branches unvisited going in live – whether it’s embedded or native s/w. Once you visit all the branches with your unit tests, objectively proven so via code coverage data, you are sure that none of your branches going in live have fatal runtime errors.
LikeLike
Thanks a lot Mr reeteshranjan for the porting
I have inquiry about dumping the generated files (.gcda) how can i automate this process with no need to send such a lot of commands to the gdb server with a project has tens of files ?
another inquiry about making the porting compatible with the latest versions of my compiler ?
LikeLike
Sorry, I am not aware of how to automate dumping the .gcda files. The porting is compatible only with v5 that I did and it may work with other versions close to v5. If you see the history of comments, several people had to downgrade their compiler version to get the port to work. Unfortunately, there is no easy way to extend this port to a current version, as the port was made by taking relevant pieces from GNU code and stripping down/modifying as required. So if this port does not work with your compiler, the possible way is to take the GNU code matching your version of the compiler, and create a similar port.
LikeLike